Install software first
| Env/Componet | Description | Description |
|---|---|---|
| System | CentOS 7.3 | http://archive.kernel.org/centos-vault/7.3.1611/isos/x86_64/CentOS-7-x86_64-DVD-1611.iso |
| Go | 1.11.4 | https://prometheus.io/download/#prometheus |
| Prometheus | 2.6.0 | https://golang.org/dl/ |
| Grafana | 5.4.2 | https://dl.grafana.com/oss/release/grafana-5.4.2-1.x86_64.rpm |
Install Go
1 | tar -C /usr/local/ -xvf go1.11.4.linux-amd64.tar.gz |
Install prometheus
1 | tar -C /usr/local/ -xvf prometheus-2.6.0.linux-amd64.tar.gz |
If the target ip:port already know,then edit prometheus.yml may more convient.1
2!/bin/bash
/usr/local/Prometheus/prometheus --config.file=/usr/local/Prometheus/prometheus.yml &
check on browser 127.0.0.1:9090
Install grafana
1 | rpm -ivh --nodeps grafana-5.4.2-1.x86_64.rpm |
check on browser 127.0.0.1:3000
https://blog.csdn.net/ywd1992/article/details/85989259
jar exporter
- for mointor jar, we need dispatch unique jmx port to every jar process.
- download prometheus jar exporter and jmx_exporter tomcat config file.
1 | # target package |
config jmx exporter
replaceCatalinatoTomcat
name withjar_config.yaml1
2
3
4
5
6
7
8
9
10
11
12
13
14
15
16
17
18
19
20
21
22
23
24
25
26
27
28
29
30
31
32---
lowercaseOutputLabelNames: true
lowercaseOutputName: true
rules:
- pattern: 'Tomcat<type=GlobalRequestProcessor, name=\"(\w+-\w+)-(\d+)\"><>(\w+):'
name: tomcat_$3_total
labels:
port: "$2"
protocol: "$1"
help: Tomcat global $3
type: COUNTER
- pattern: 'Tomcat<j2eeType=Servlet, WebModule=//([-a-zA-Z0-9+&@#/%?=~_|!:.,;]*[-a-zA-Z0-9+&@#/%=~_|]), name=([-a-zA-Z0-9+/$%~_-|!.]*), J2EEApplication=none, J2EEServer=none><>(requestCount|maxTime|processingTime|errorCount):'
name: tomcat_servlet_$3_total
labels:
module: "$1"
servlet: "$2"
help: Tomcat servlet $3 total
type: COUNTER
- pattern: 'Tomcat<type=ThreadPool, name="(\w+-\w+)-(\d+)"><>(currentThreadCount|currentThreadsBusy|keepAliveCount|pollerThreadCount|connectionCount):'
name: tomcat_threadpool_$3
labels:
port: "$2"
protocol: "$1"
help: Tomcat threadpool $3
type: GAUGE
- pattern: 'Tomcat<type=Manager, host=([-a-zA-Z0-9+&@#/%?=~_|!:.,;]*[-a-zA-Z0-9+&@#/%=~_|]), context=([-a-zA-Z0-9+/$%~_-|!.]*)><>(processingTime|sessionCounter|rejectedSessions|expiredSessions):'
name: tomcat_session_$3_total
labels:
context: "$2"
host: "$1"
help: Tomcat session $3 total
type: COUNTERstart jar with exporter
1 | !/bin/bash |
- add prometheus config
1 | - job_name: 'tomcat' |
- add grafana dashboard
add jar dashboardhttps://grafana.com/dashboards/8563
https://www.jianshu.com/p/8a5e681b18ce
to config alert on grafana
First i want add email channel, but the smtp inside is restricted,
and go not support none ssl unencrypted connection.
I even install a email server software hmailserver, but still not work.
So i give up, and use dingding notice robot instead.
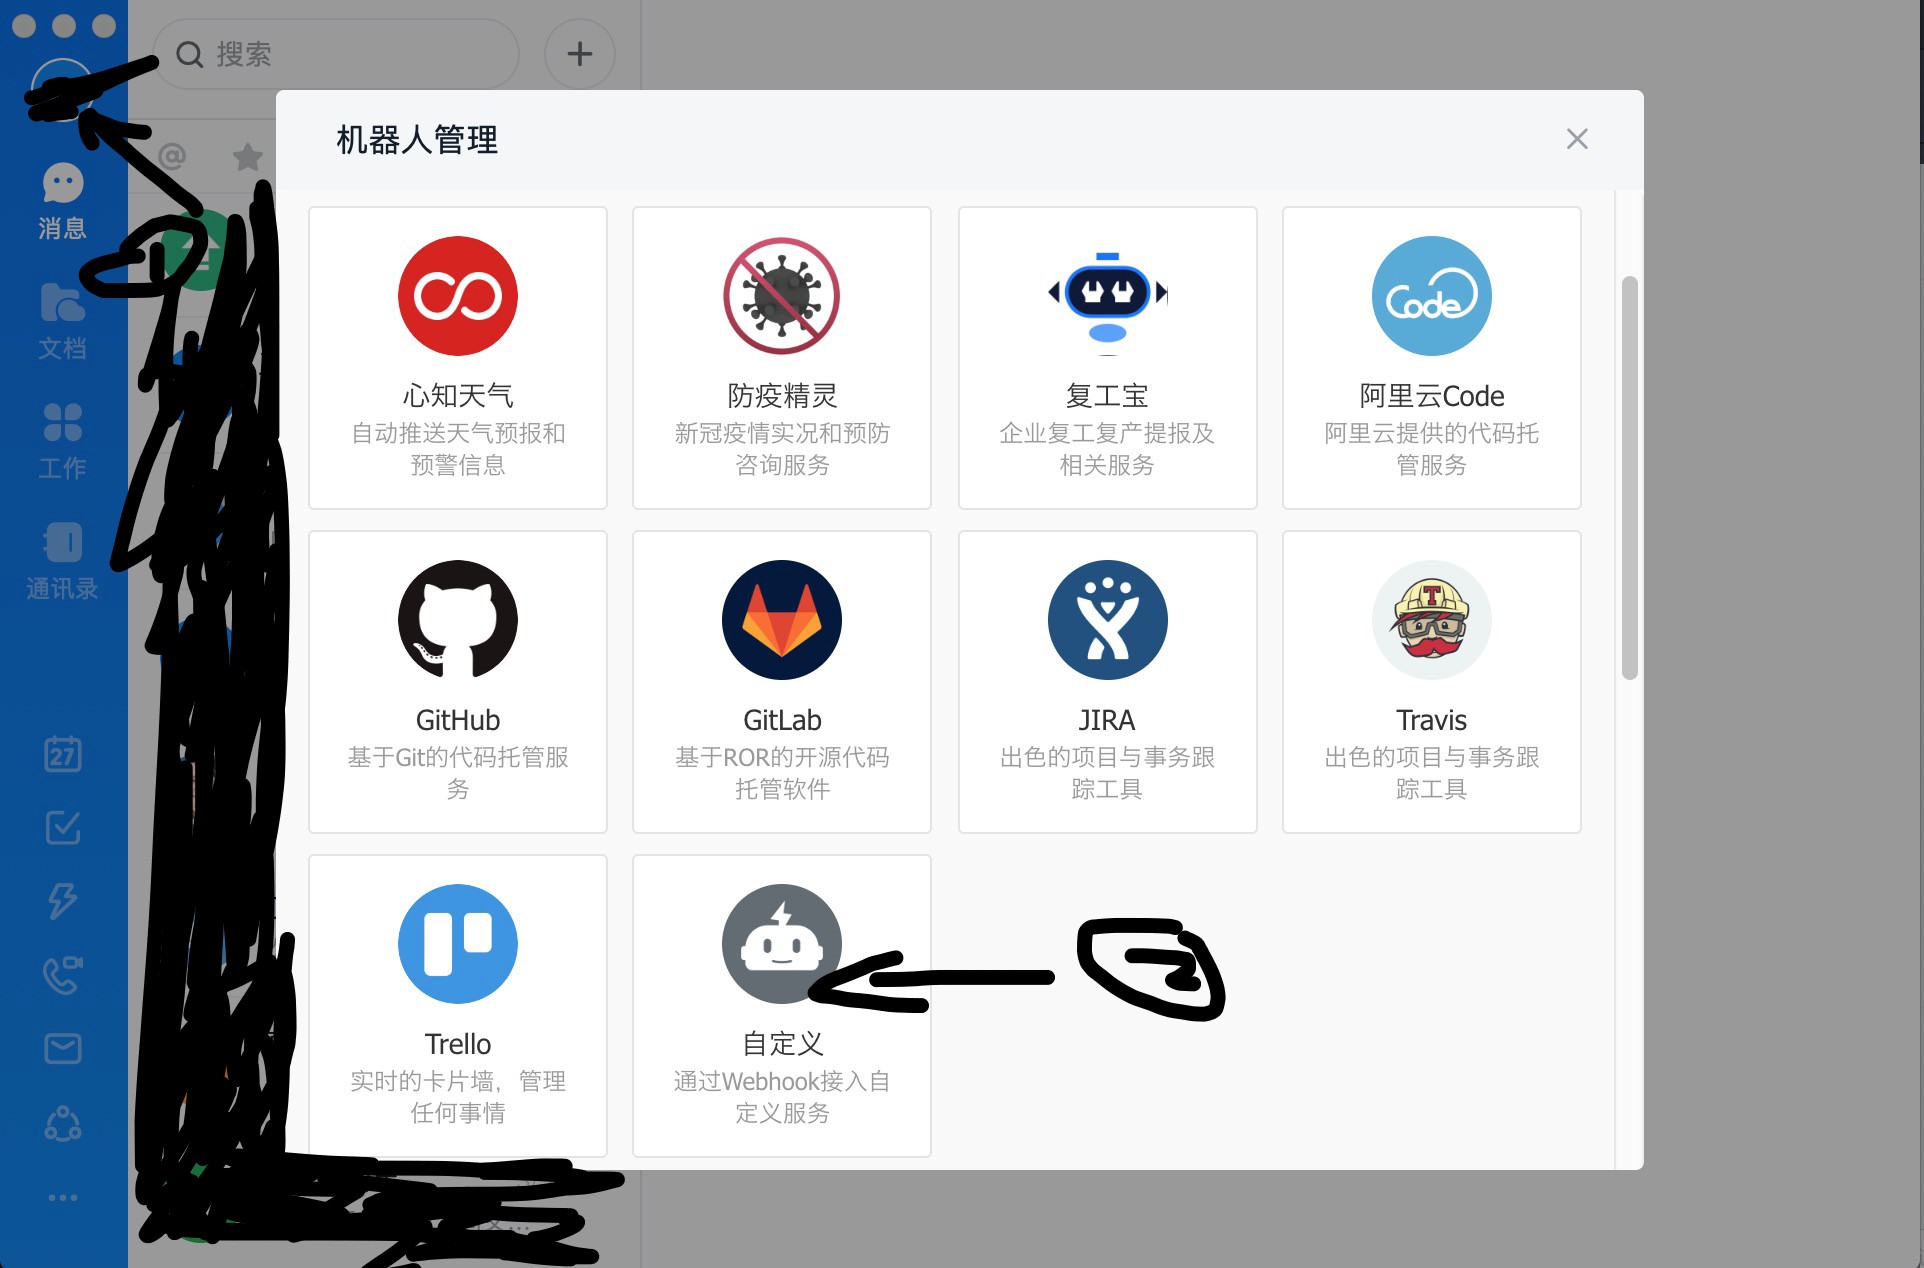
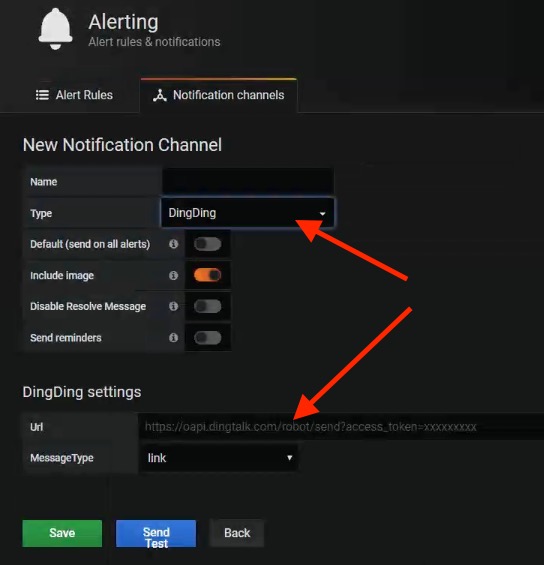
Add grafana alert channel
Add query panel
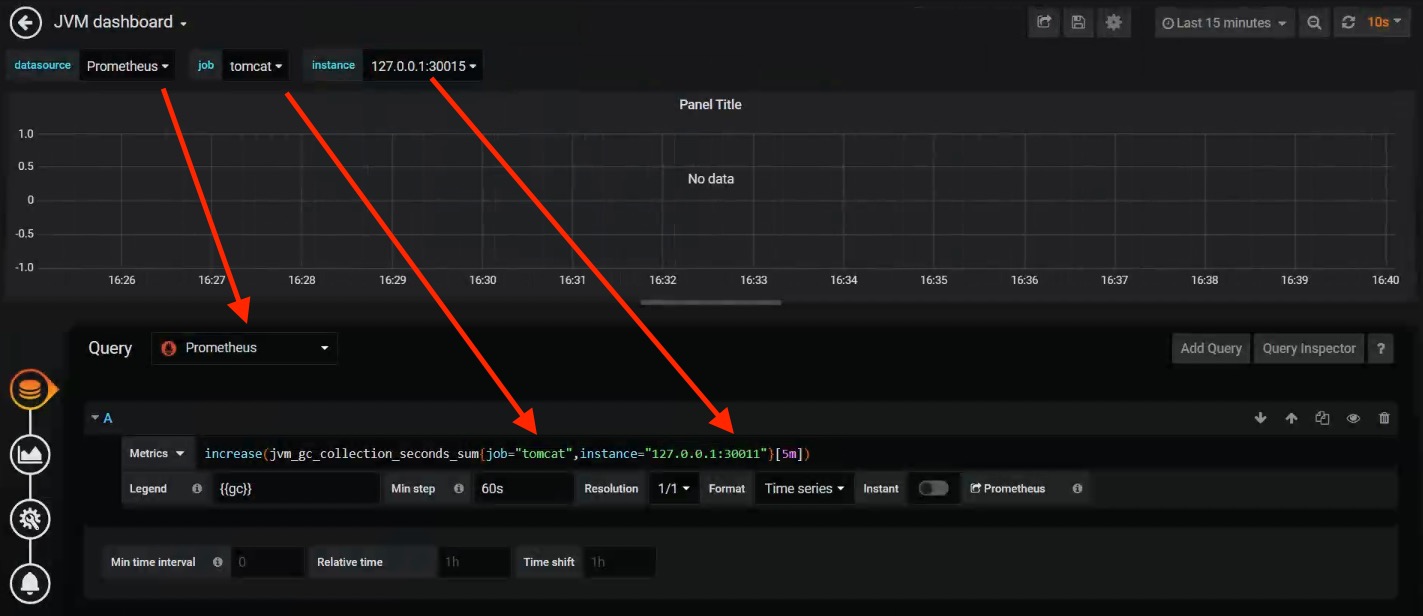
If the min step format not correct like 60, the alert rule may throw error.parse error at char 88: missing unit character in duration
Add alert rule
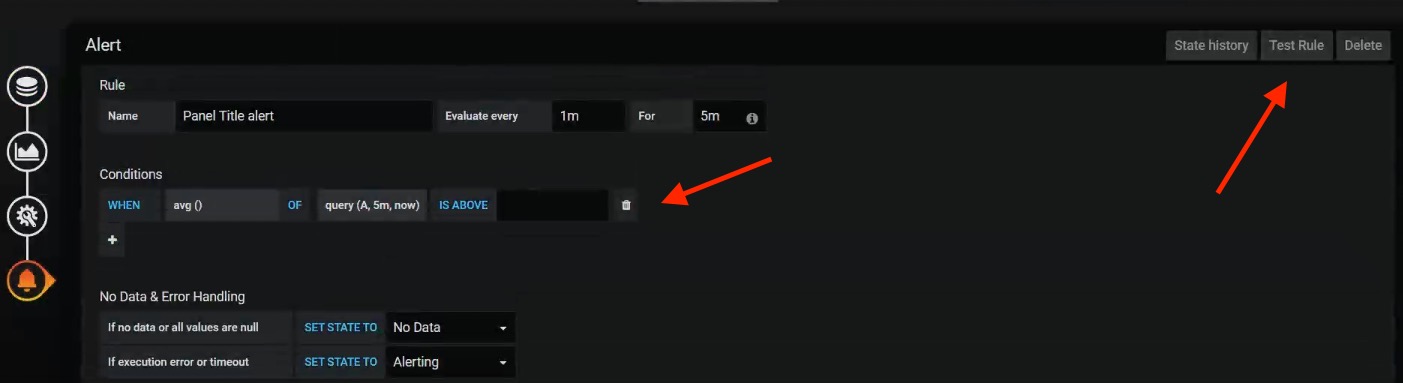
The 8563 dashboard’s panel can’t be used to mointor target directly.
Exception will be throw when you edit panel and add alert directly.
Make sure the panel query has point the target instance, then add alert.
https://grafana.com/docs/grafana/latest/alerting/rules/
https://www.jianshu.com/p/2b230390f37e
https://github.com/FUSAKLA/alertmanager-grafana-dashboard/issues/1
https://yq.aliyun.com/articles/250063